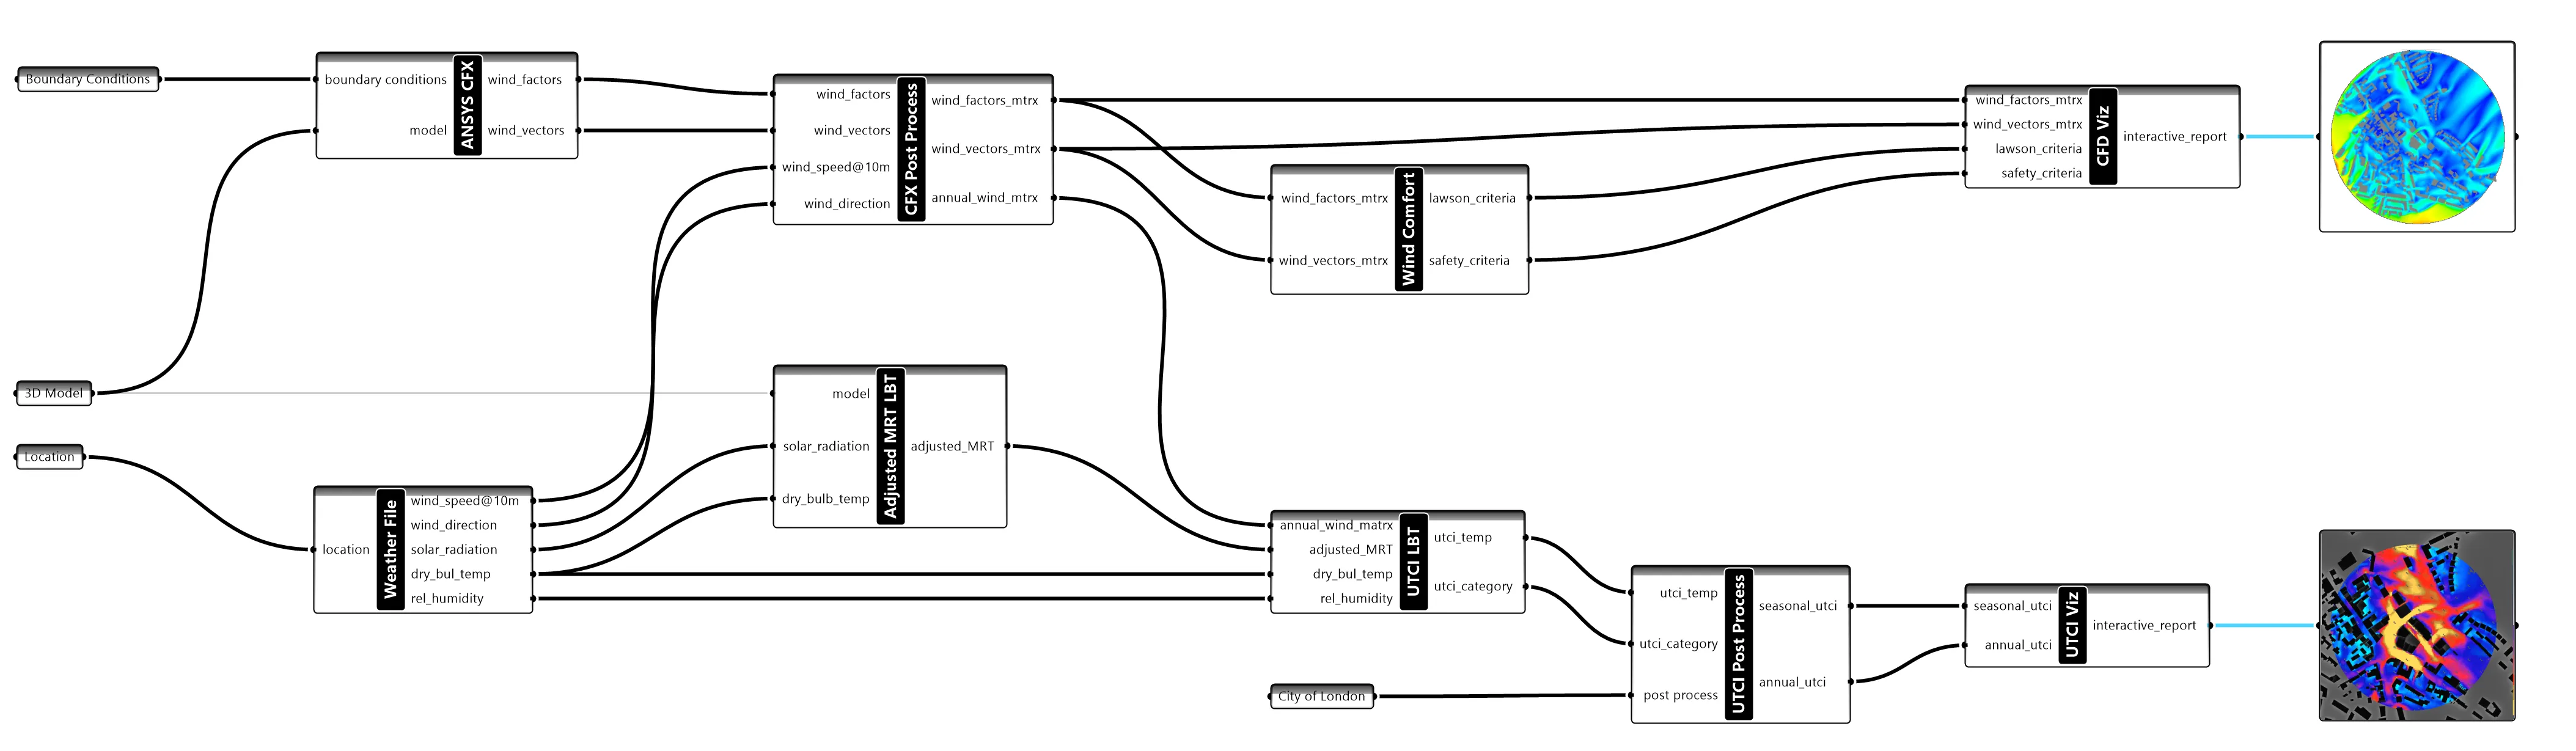
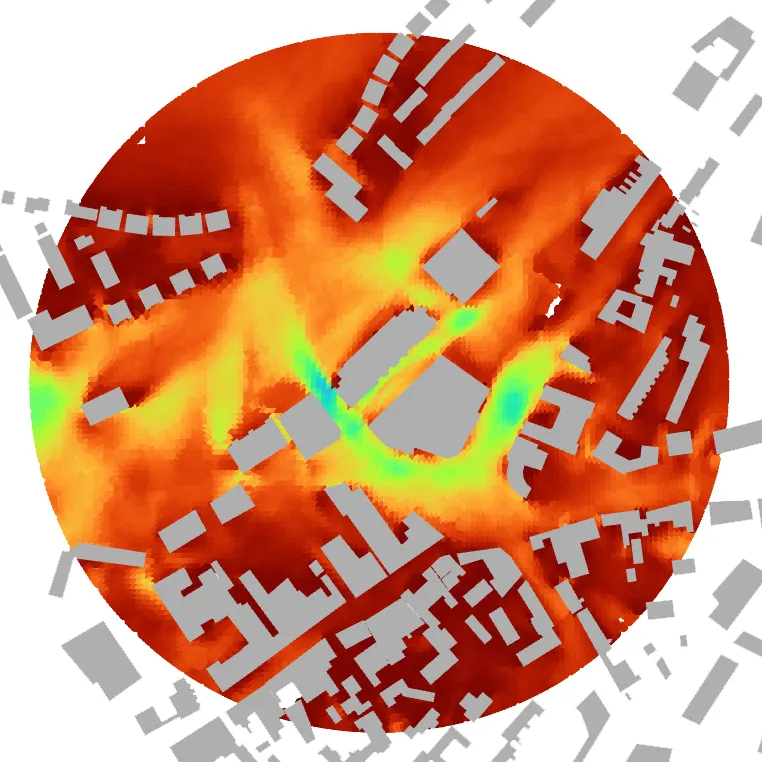
As part of my R&D work at Hoare Lea, I built, from scratch, an exterior comfort simulation process compliant with City of London regulations for new developments. The process couples a 36-direction CFD analysis (ANSYS) with a Mean Radiant Temperature (MRT) simulation using Radiance, EnergyPlus, and Python, all integrated via Ladybug Tools inside Grasshopper 3D.
These simulations generate large data volumes that must then be processed per regulation. In this case 13,000 points were analysed, producing matrices of 114,000,000 values per metric (wind speed and mean radiant temperature). Computing UTCI required disciplined data handling and a fully programmatic post-processing pipeline.
BESPOKE DEVELOPMENT
A core part of my role on the Building Physics Team at Hoare Lea is developing, improving, and automating analysis workflows. That means continuous evaluation of new technologies, software, and programming approaches that can improve how the team works, and packaging those into tools the team can actually use.
THERMAL GUIDELINES
The City of London’s Thermal Comfort Guidelines for Developments was published in December 2020, outlining a methodology to assess new buildings using computational simulation.
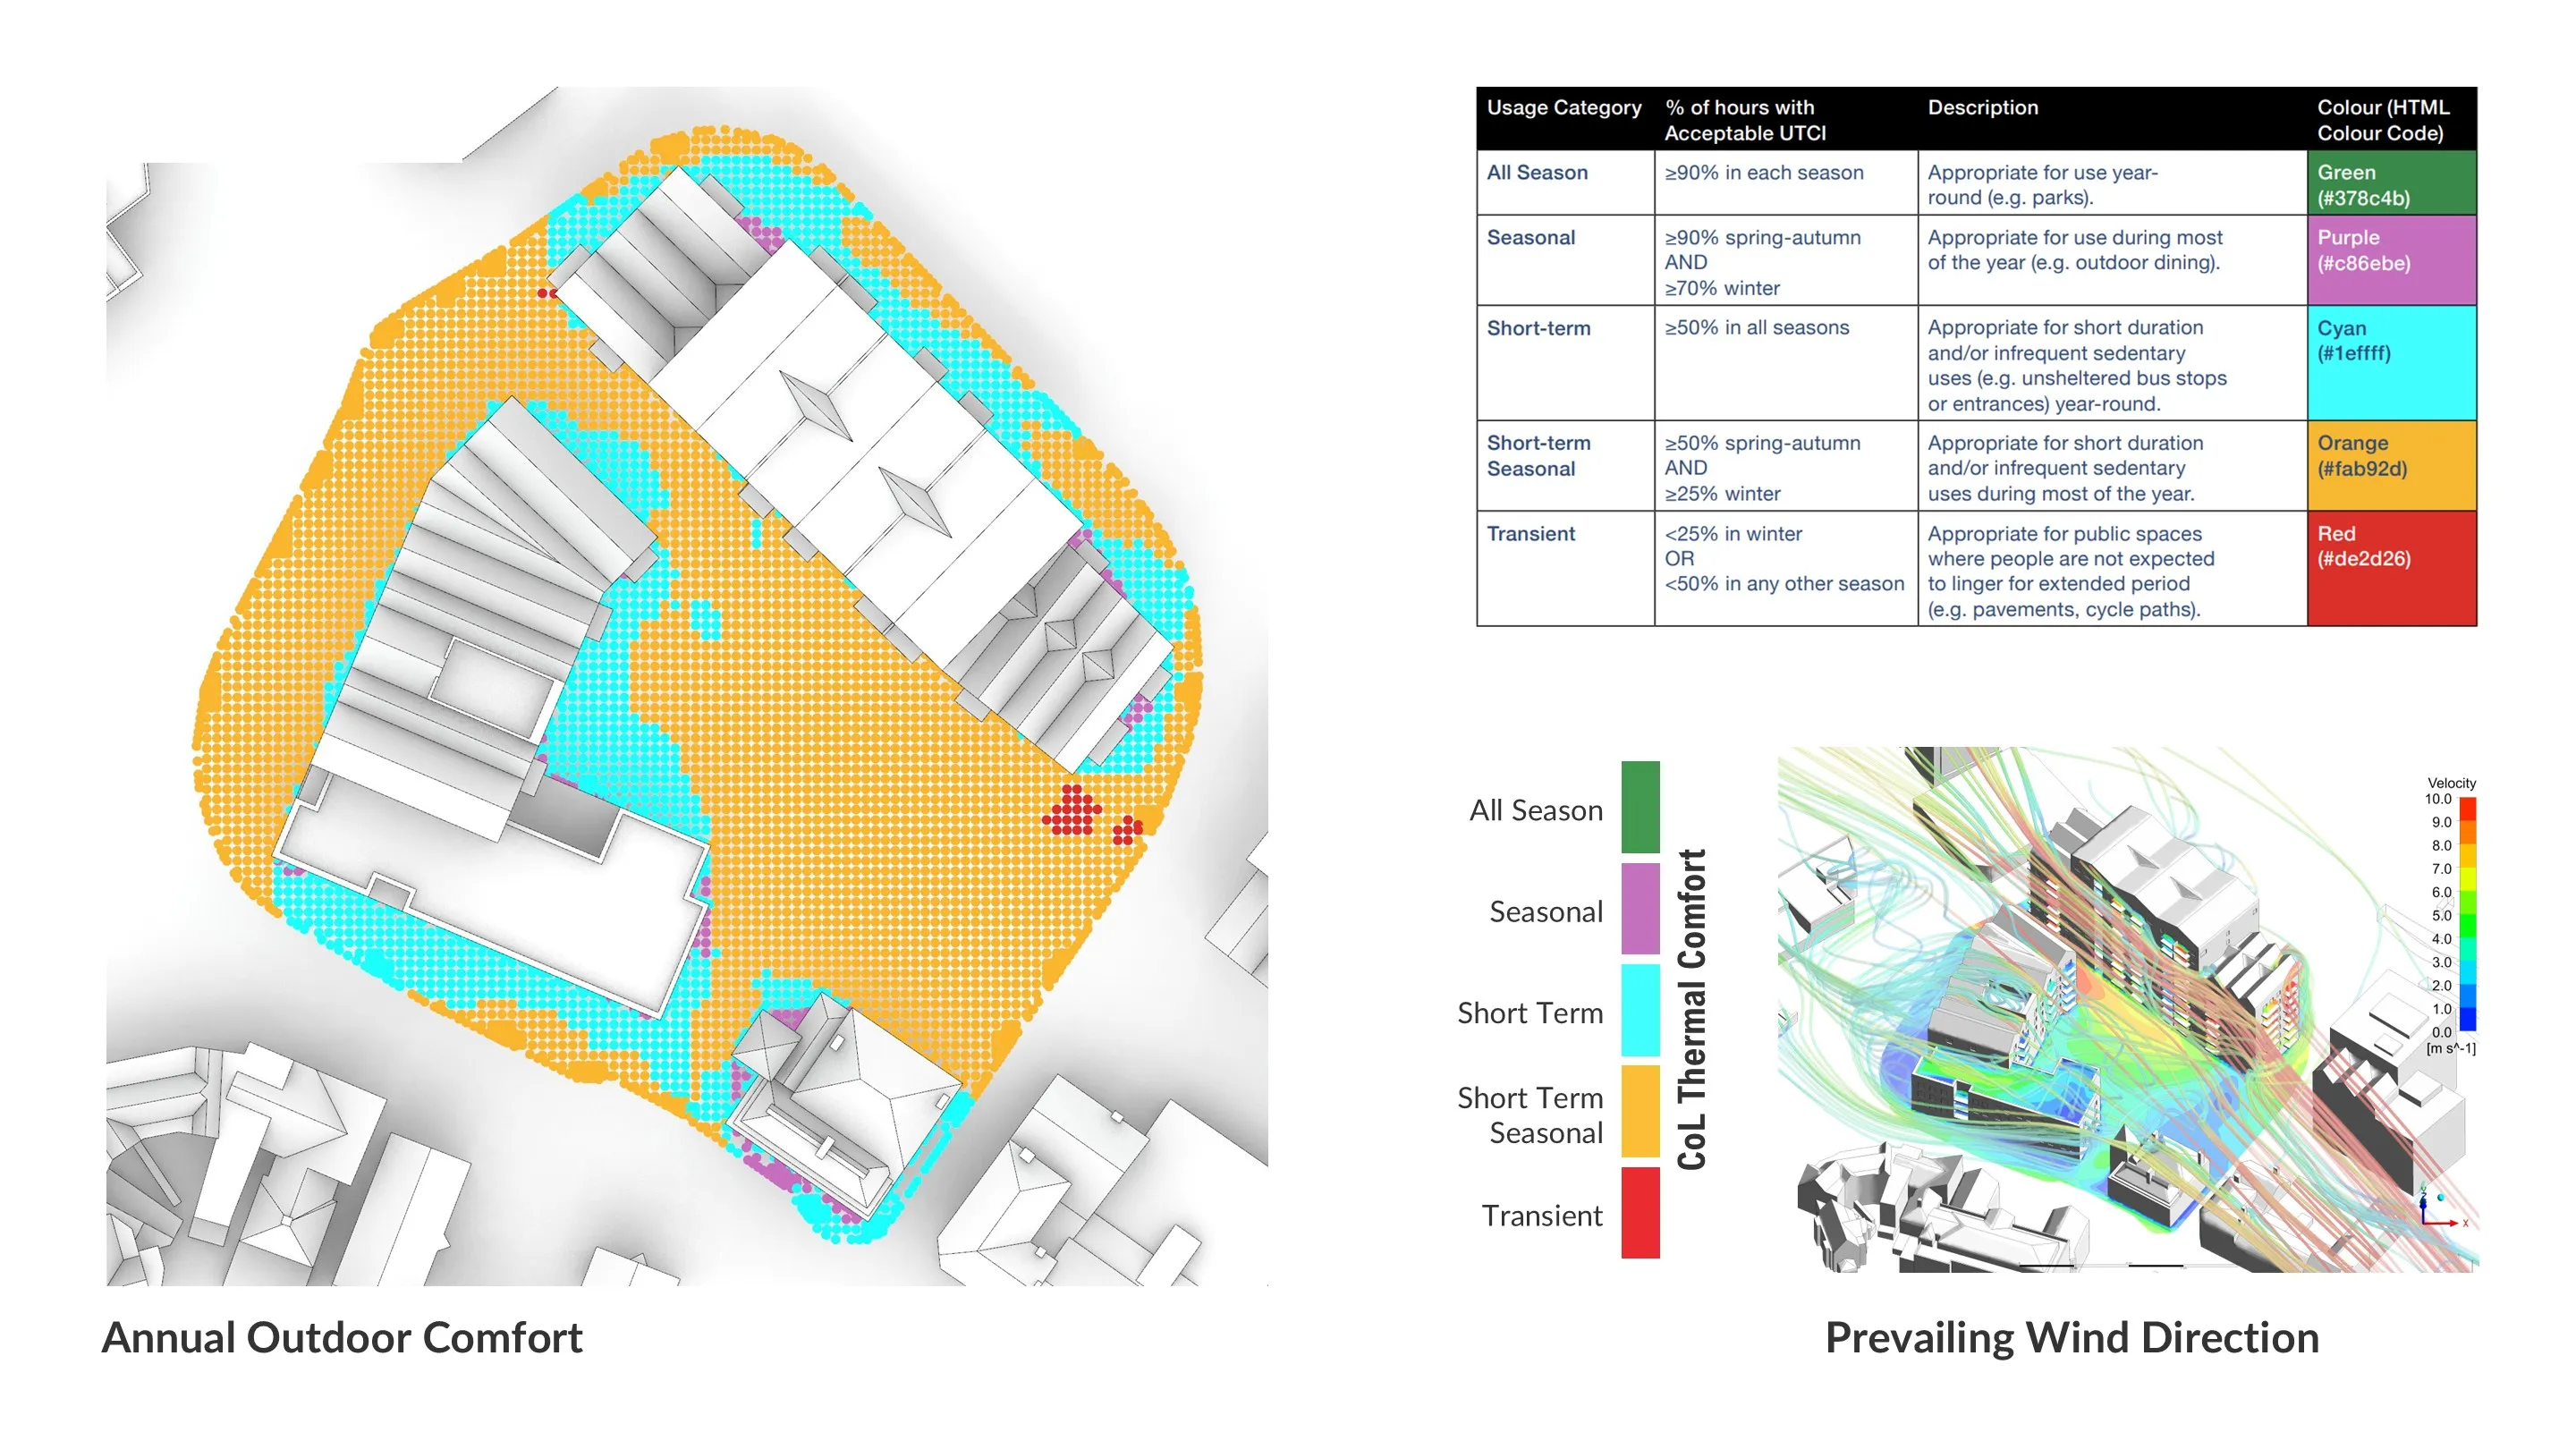
The guideline describes a workflow that merges wind, sunlight, temperature, and humidity microclimate data at seasonal resolution to give a holistic read on thermal comfort, showing how the microclimate of a place actually feels to the public.
ACHIEVEMENTS
- Launched a new high-value service for the consultancy.
- Built a complete and robust workflow to assess outdoor comfort per the City of London Guidelines.
- Deployed the tool to the Building Physics Team for production use.
- Automated results post-processing using performant Python libraries.
- Automated results visualisation and export using Python.


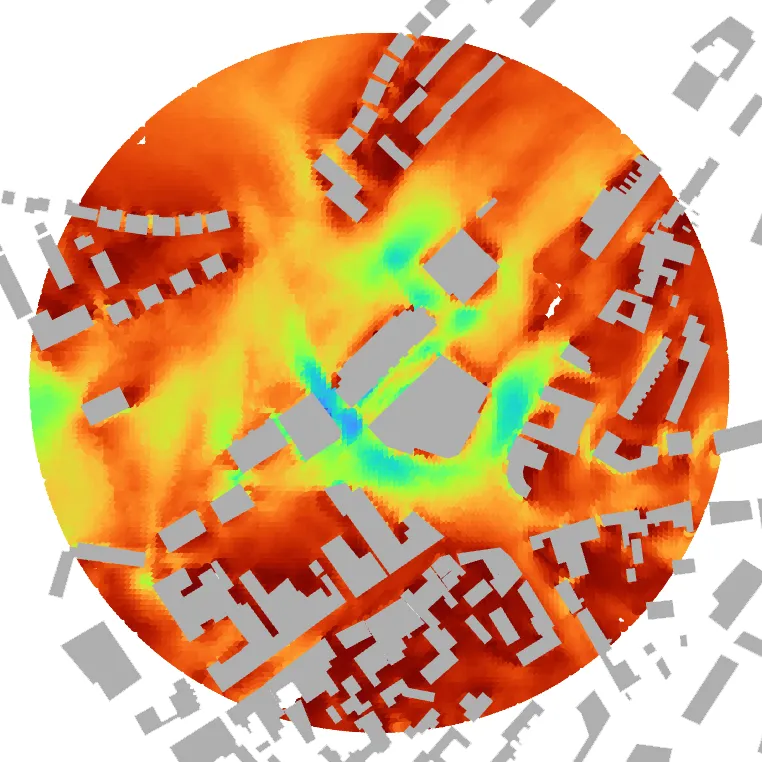

Seasonal Percentage of Time in Comfort
The regulation requires results to be presented by season using the following inclusive time periods:
- Spring: March – May
- Summer: June – August
- Autumn: September – November
- Winter: December – February
Results are clipped between 8:00 and 20:00 as per the guidelines.
Disclaimer
All simulations, images, and workflows were developed by the author.
THERMAL COMFORT CRITERIA
The Universal Thermal Climate Index (UTCI) is used to predict thermal comfort in the City of London.
UTCI is computed for every hour of the climate time-history using the standard formulation, and the frequency of UTCI between 0 °C and 32 °C is computed for each season. This range is considered appropriate for outdoor pedestrian use. Results are clipped to the hours between 8:00 and 20:00.
| Category | % of Hours in Comfort | |
|---|---|---|
| ● | All Season | ≥90% in each season |
| ● | Seasonal | ≥90% spring–autumn AND ≥70% winter |
| ● | Short-Term | ≥50% in all seasons |
| ● | S-T Seasonal | ≥50% spring–autumn AND ≥25% winter |
| ● | Transient | <25% in winter OR <50% in any season |